Hello Everyone,
Hope you all are doing good!
Model-driven apps in Microsoft Power Platform enable the creation of sophisticated, data-driven applications. Yet, diagnosing problems in these apps can be tricky, particularly when working remotely or across distributed teams. Fortunately, Power Platform’s Monitor feature provides a robust solution for troubleshooting and debugging these apps from any location.
In this blog post, we’ll dive into how you can use the Monitor feature to debug model-driven apps remotely, streamlining and enhancing the debugging process.
What is the Monitor Feature?
The Monitor feature in Power Platform offers real-time insights into app performance and user interactions. It collects detailed logs, telemetry data, and performance metrics, enabling developers and administrators to effectively track, diagnose, and address issues. This tool is particularly beneficial for remote debugging, as it delivers a thorough overview of the app’s behavior and performance without requiring physical presence.
Getting Started with Monitor
1. Access Monitor
To use the Monitor feature, you’ll first need to access it from the Power Platform Admin Center. Ensure you have the necessary permissions to view and manage telemetry data for your environment.
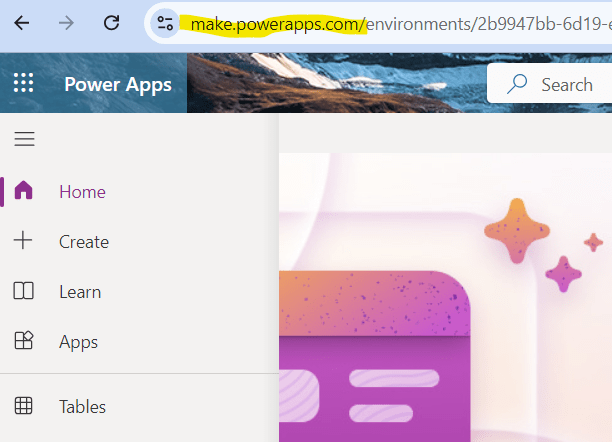
- Go to the make.powerapps.com.
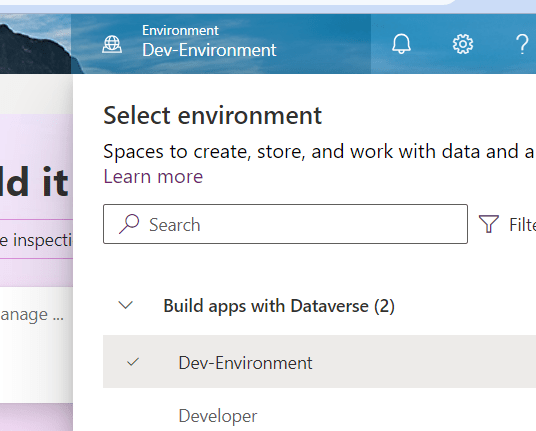
- Select the environment you want to monitor.
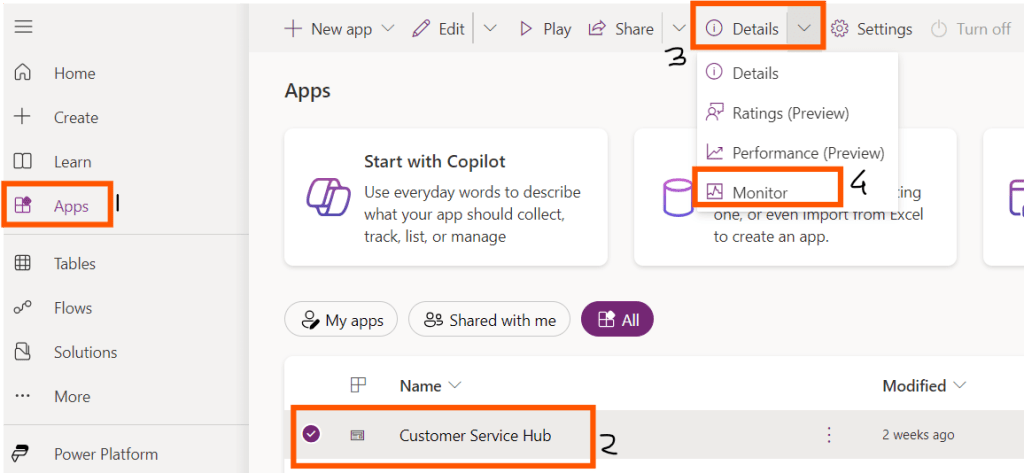
- Navigate to the “Apps” >> Select the app you want to monitor >> Details and then click on “Monitor.”
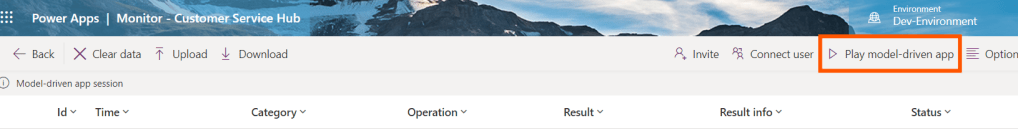
- Now, click on “Play Model Driven App”.
- Click on join.
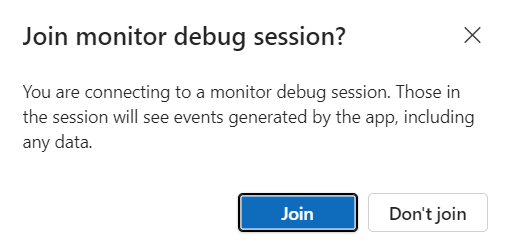
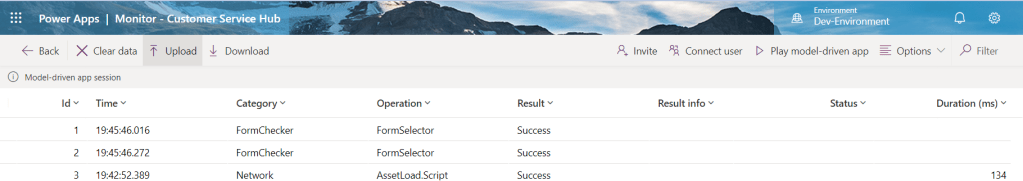
- Once you click on Join, your app will run in debug mode and you can see the Monitor tab and notice that it has started capturing the logs based on your operations.
Best Practices for Remote Debugging with Monitor
- Define Objectives: Clearly define what issues you are trying to diagnose or resolve. This helps in configuring Monitor effectively and focusing on relevant data.
- Regular Monitoring: Incorporate regular monitoring into your app management routine to proactively identify and address issues.
- Collaborate Effectively: Share insights and logs with team members to facilitate collaborative troubleshooting and resolution.
- Leverage Documentation: Familiarize yourself with Microsoft’s documentation and best practices for using Monitor to make the most of its features.
- Continuous Improvement: Use the insights gained from Monitor not only to fix immediate issues but also to drive continuous improvement in your app’s design and performance.
Conclusion
Debugging model-driven apps remotely is streamlined with the Monitor feature in Power Platform. By leveraging real-time data, detailed logs, and performance metrics, you can effectively diagnose and resolve issues without needing to be physically present. Setting up Monitor correctly and following best practices will ensure that your model-driven apps run smoothly and deliver a seamless user experience, no matter where your team is located.
Happy debugging!
Hope it helps!
Let’s_Learn_Together
Thank you!!

Leave a comment